My Formulas
Life is really simple, but we insist on making it complicated.
—Confucius
My formulas for trend reversal include a long list of different ingredients and tools, fine-tuned during my thirty-six months of back-testing.
My system uses the Bollinger Bands, a trading tool created in the 1980s by John Bollinger, which are represented by two lines used as “Standard Deviations” around a 20 periods Moving Average, and are used to determine whether the prices are high or low in relation to their history. The method is derived from the observation that volatility is dynamic and not static.
In a moderate inclination, the Bollinger Bands are used as a channel with the establishment of a purchase if the price touches the bottom band and a sell if the price comes in contact with the top band, while following the established trend.
According to their creator, the price should stay contained within the bands in 88% of cases.
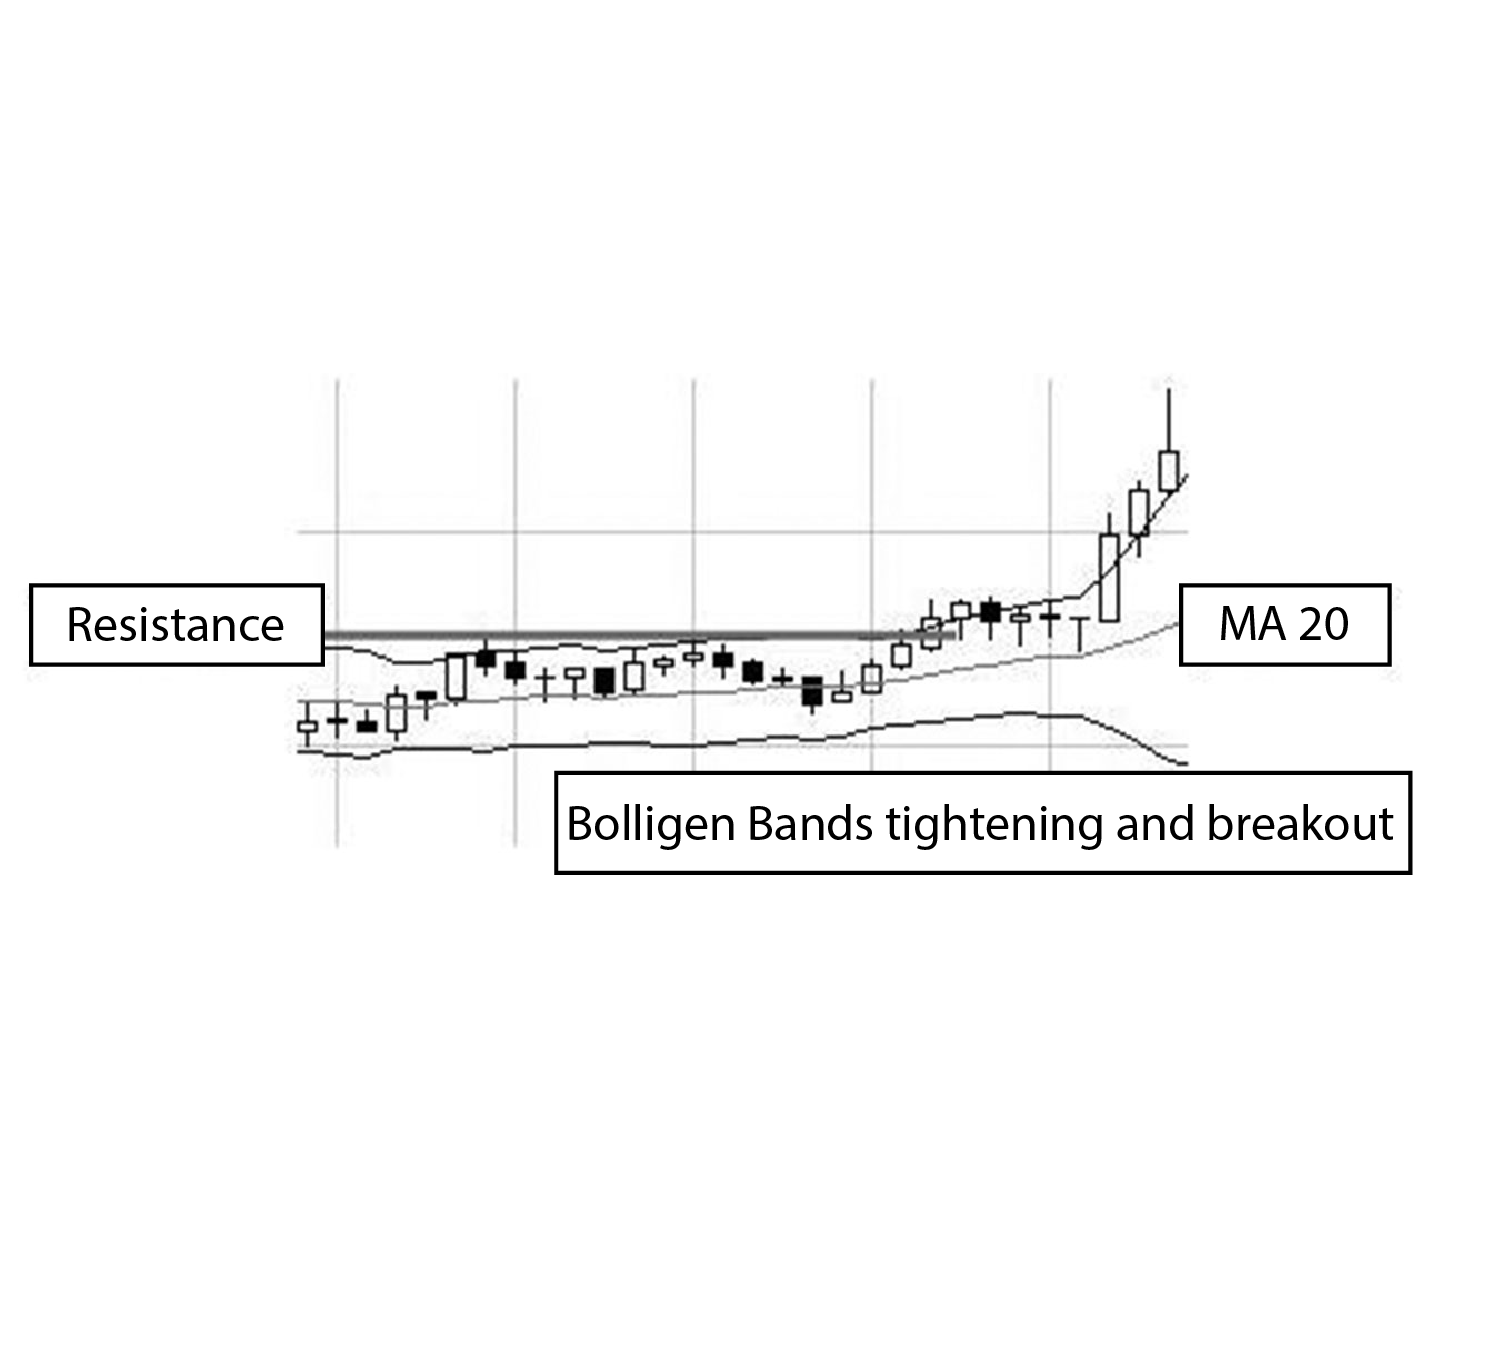
Bollinger Bands & Momentum Breakout
Their calculation is largely influenced by the close of each candle and when the bands tighten to get very close, a major move can be expected, causing a change sometimes brutal in price before they can gradually return to a more normal distance from the Moving Average between them.
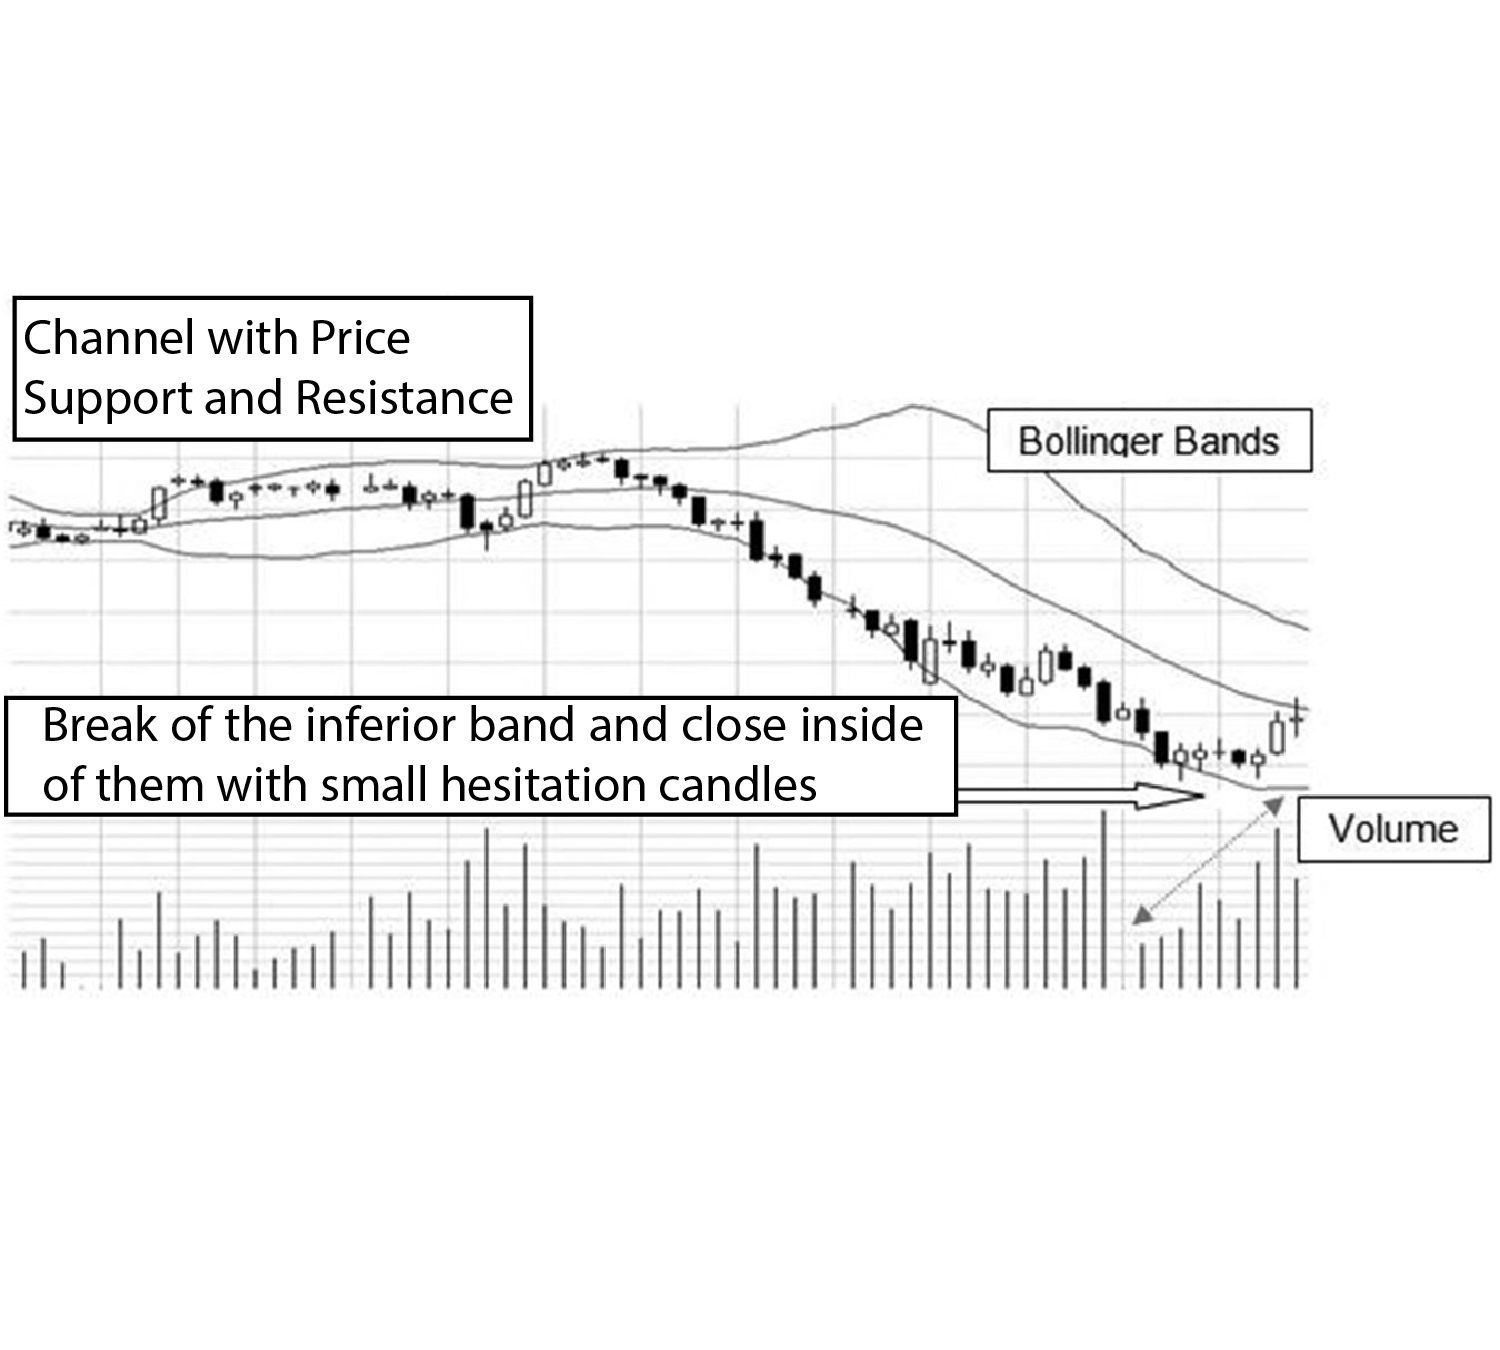
Bollinger Bands and Reversal
Another example of using the Bollinger Bands is when the trend is down for a long time and each bar has touched the bottom band. If the price falls below the lower band but comes back to close inside, it has potential to reverse. After a short consolidation where several small candles appear at the same level, a rise in price can be anticipated, particularly if the base has formed with a higher volume on positive candles. This purchase is made after a visible signal, the trigger candle having the shape of a Doji or a Hammer.
The stop is then placed just below the last price low.
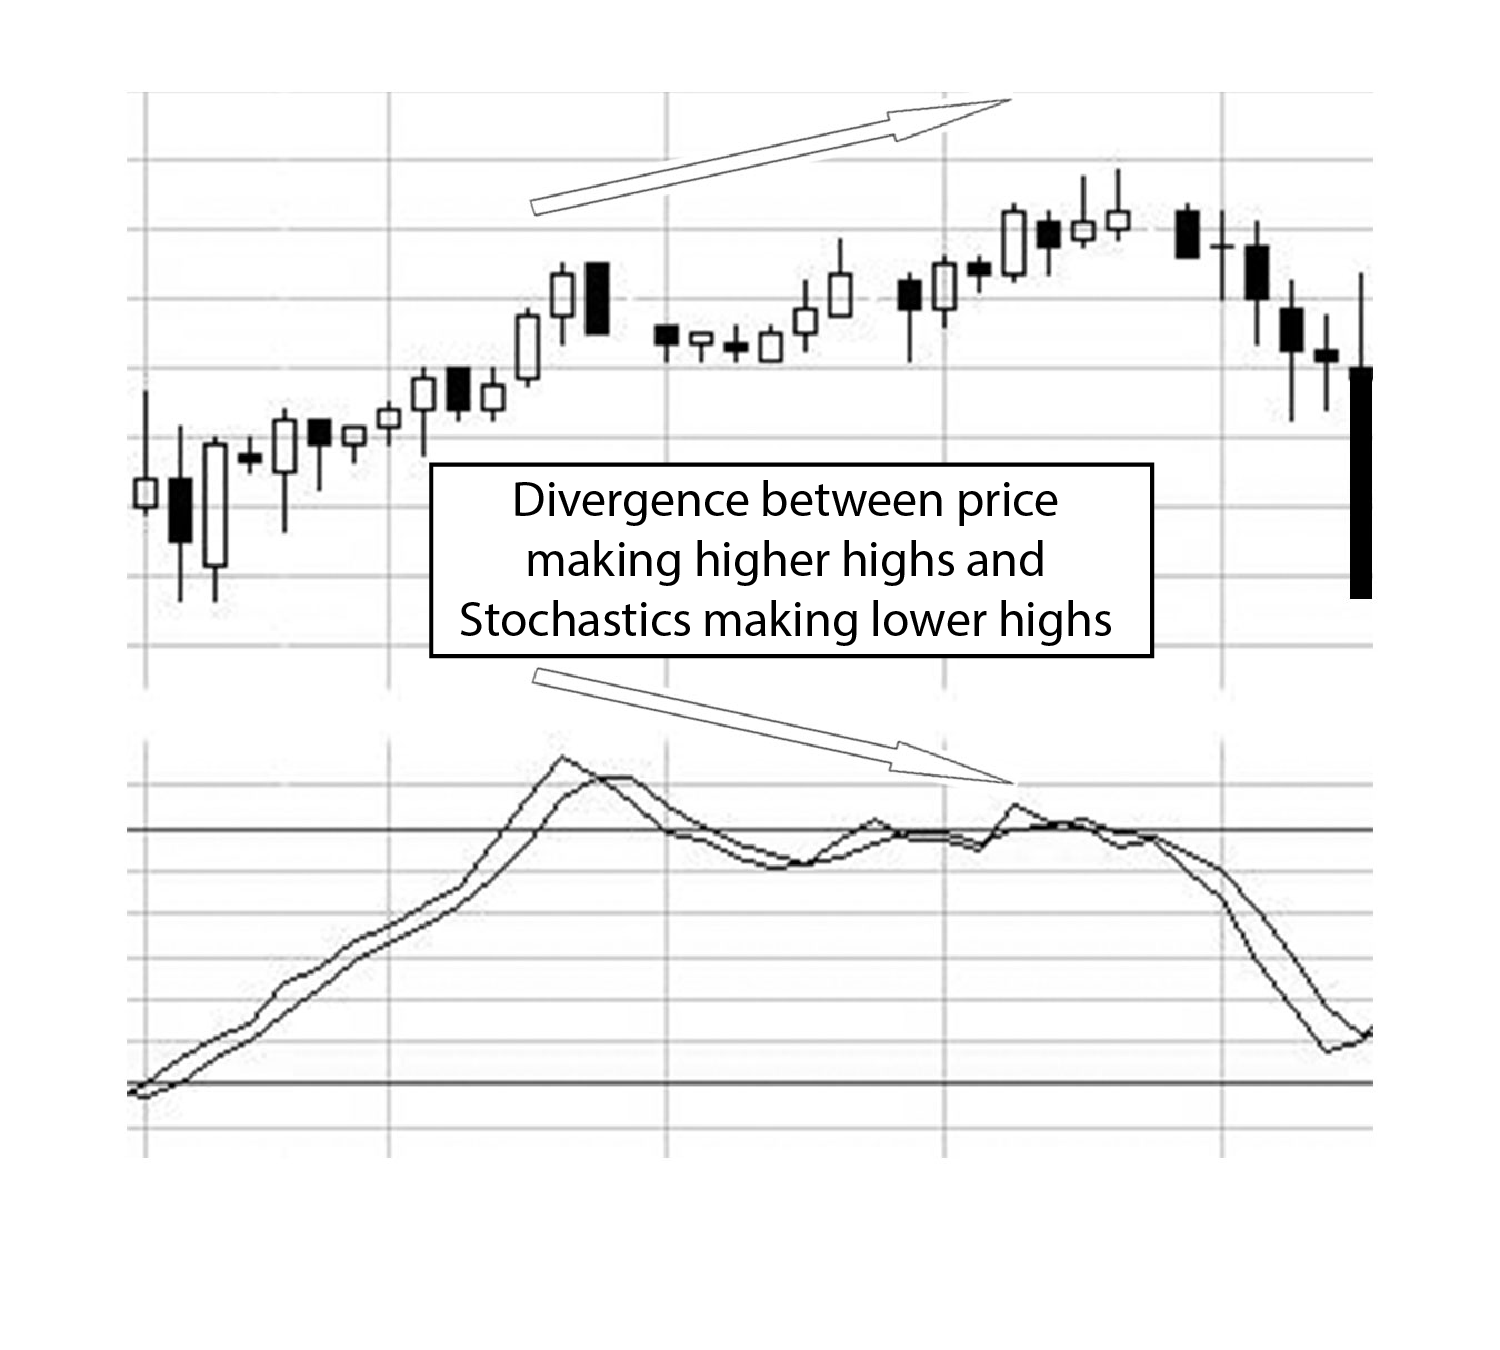
Divergence Stochastics
Among my best configurations tools are the Slow Stochastics. Dr. George Lane developed this momentum indicator in 1954, after his teachers began the research, and according to him, this indicator was to be used with cycle analysis, the Elliott Wave principle and the Fibonacci retracements.
Its formula is to take the closing price and to compare it to its price range, over a period of time. Apparently, the “Stochastic Oscillator” does not follow the price and does not follow the volume; it obeys the momentum speed of the price.
The sensitivity of the oscillator to market movements makes it essential, since its evolution will change direction before the price. As such, a bullish or bearish divergence can better signal a reversal of the value and therefore, announce a change in trend.
The theory behind this indicator is that in a bull market, prices generally close near their high, and in a bear market, the closing is near their lowest point.
A transaction signal is given when the moving average of three bars or candles (called %D) cross through the 14 bars (%K). If the %D crosses %K up, below 20% of the graph, it is a buy signal and when the crossing is down, above the 80% level, the signal is to sell.
When drawing a trend line on the Stochastics, if its tilt shows a divergence with the direction of the price graph, it is often an indication of a trend change, or at least a weakening of the visible direction.
Combined with other analyses the regular use of the Stochastics is very helpful, giving a signal that goes against the trend to announce its end.
CCI
Another useful indicator, the CCI, was created by Donald Lambert in 1980.
It was originally designed for commodities, hence its name “Commodity Channel Index”, but it has been adopted in all markets. It looks a little like the “Stochastic Oscillator”, although is more volatile.
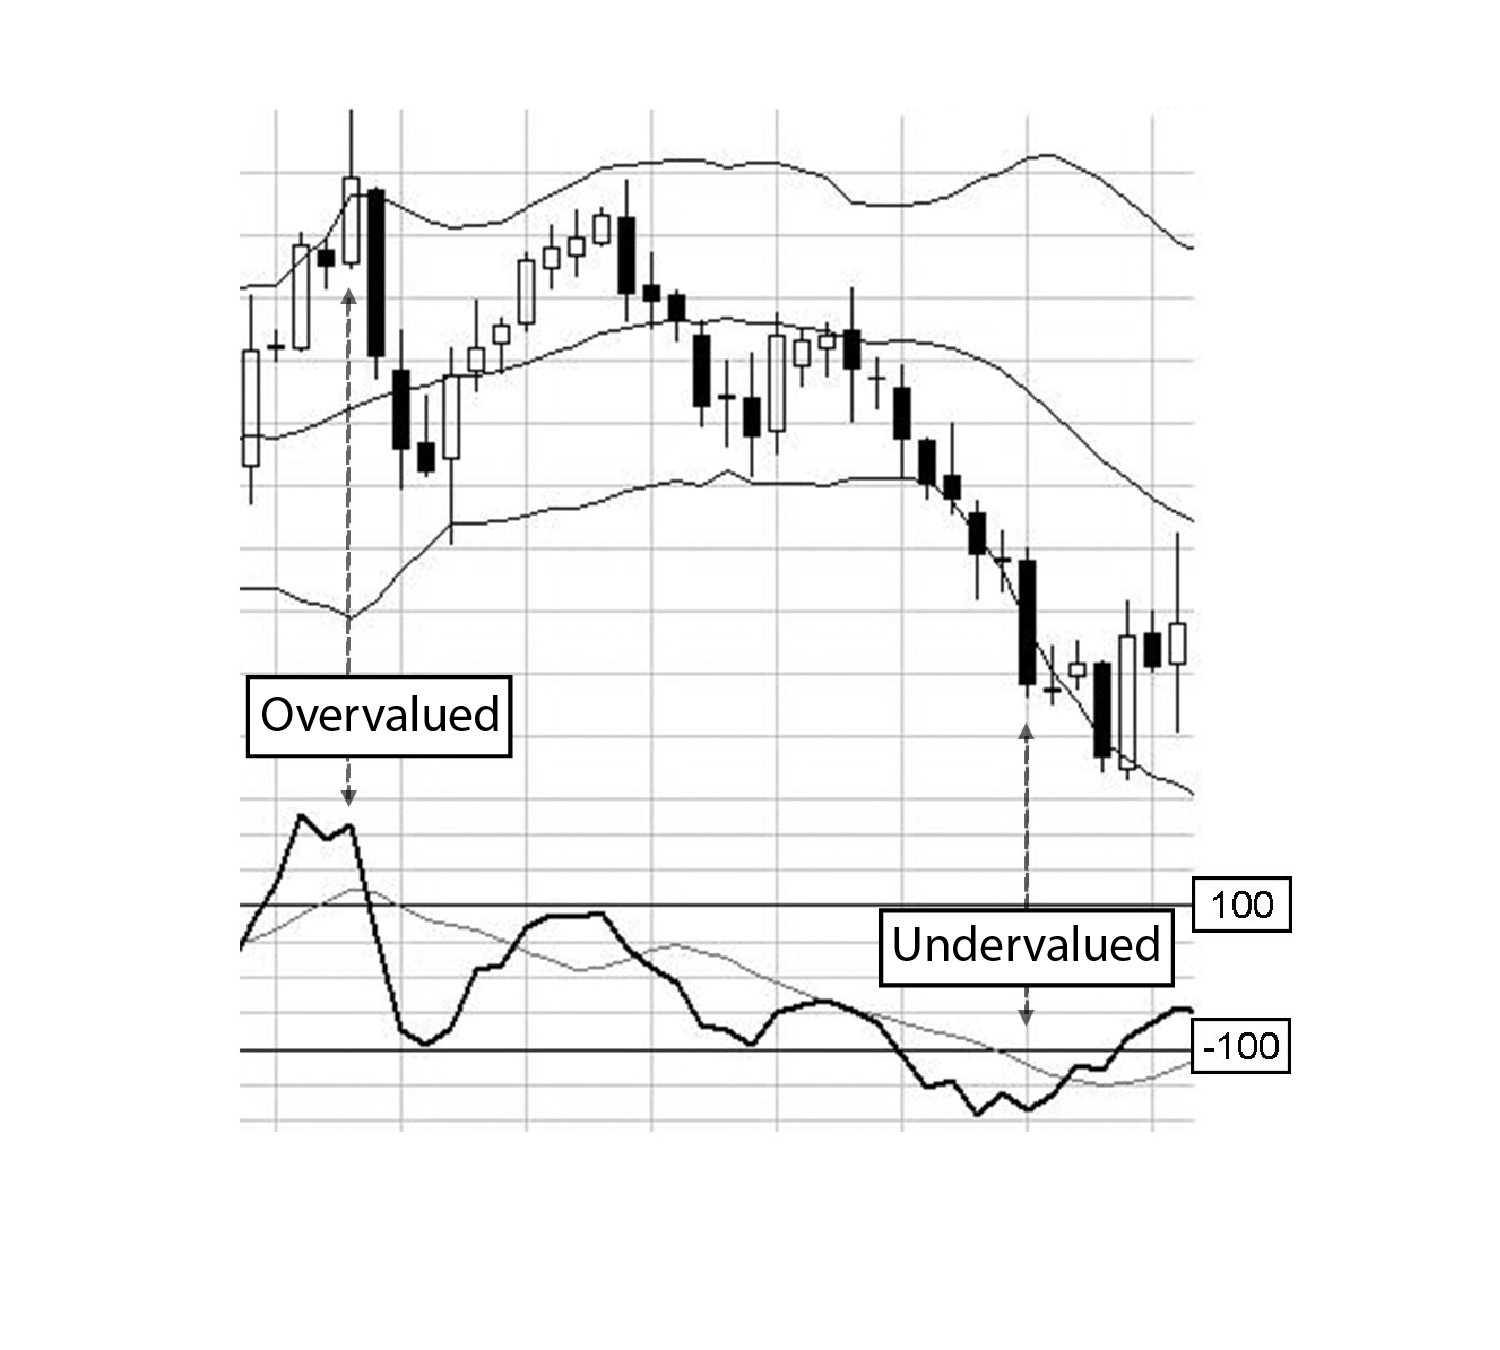
A high level CCI indicates an overvalued price and gives the incentive to sell. A very low CCI reports an undervalued price and purchase can be considered.
To filter the small changes and only keep the most relevant information, two levels are plotted on the graph, at 100 and -100. According to the inventor, most of the oscillations are realized inside these levels and they are not interesting.
Therefore, as the level varies between -100 and 100, there is no suggestion and the graph is supposed to be in a consolidation period. But above 100, a decline is anticipated and below -100, an increase is considered.
The combination of these indicators is at the heart of my formulas.